Friday 14 September 2012

And the winner is...


Hey People!!!

So this post is going to be a bit different, no coding, no snapshots, no javascript! I promise!!

This week was the annual bioinformatics conference here in South Africa, it was really cool to see old friends and to know what are they up to these days, and also pretty interesting to know new people and their works.

Submitting a work for this conference was a little different form others, they didn't allow to select between posters or oral presentations. You have to submit your abstract and if accepted they decide the participation type (poster or talk).

Honestly I'm not fan of poster sessions, I found them hard to deal with, people go and check the poster without rally been interested on them, and the presenter find himself repeating the same speech several times in the best case scenario, worst case been nobody show interest in your work and you just stay in front of your poster with nothing to do for as long as the session goes. So, obviously when I wrote my abstract for this conference I was hoping to get an oral presentation.

And... poor me, they select the abstract for a poster... damn! I even though I was not gonna take part of the conference anymore, or just going but not presenting. To be honest, their reasons for not giving me a talk were pretty valid, my abstract didn't have many details of my research, and it was more about Web Visualization in general, and I did it that way because when I wrote it, I didn't have anything I want it to present, all I have where my sketches and a couple of the components I have talk about here, but not real results! Anyway I still thing I could it done a really cool introduction talk about web visualization for bioinformatics.

Anyways, I reckon a poster presentation is better than nothing, so if I was gonna make a poster I was gonna do a really cool one. So I started by asking my self why I dont like posters, and one of the things I hate of poster sessions is that most of the posters look like their author just put the whole content of a paper in the limited space of the poster, so it end up been a lot of text, in a small font that you can't read from distance, a couple of stats graphics, and two or three logos.

It also bothers me the square that research posters are these days, boxes, texts, graphics, logos. But apparently I'm not the only one with this kind of concerns. A friend from the lab sent me this link (http://betterposters.blogspot.com/) after listening to all my quetching!

In contrast to when I wrote the abstract, last week i had a tool in a prototype state that i can really show, so I decide to focus the poster about it, I'm obviously talking about the interaction application that I have chatted so much in this blog (just have a look to this, this and this posts).

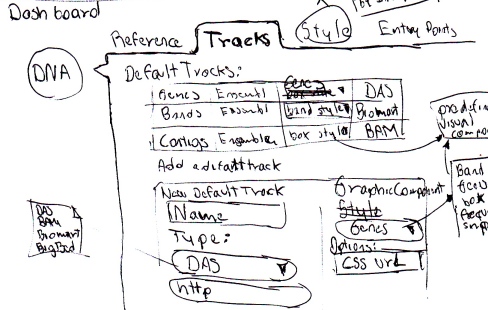
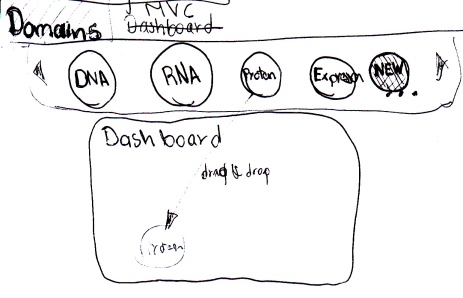
So, with the idea of doing something different and inspired on the application it self, I though I can do the poster resembling the networks that the software is visualizing, and here is a very quick sketch that I did with that idea on mind.
Sketch for the poster layout

So the first decision is which software to use to design a poster. A lot of people uses MS PowerPoint for it, but I haven't using that since i met google docs, unfortunately I dont think is feasible to work on design in a web application, specially for something big as a poster, at least not for now.

I have worked with several packages for design before: photoshop, fireworks, illustrator and Gimp. I discover recently that Gimp finally release a version runs on OSX natively, and thats a great deal for me cause I always like it Gimp, but the fact that it was running on X11 made it unnatural to use... Anyway going too technical again, what I'm saying is that if you work in a Mac, you should give it a try to the newest version of Gimp, for you photo editing and design tasks. Is a good software with GNU licence!!

Took me 2 days of work to get the design as I wanted, for one thing it was the first time using this new versin of Gimp, and on the other hand, my design skill were a little rusted. But I did get what I wanted at least in form, the content was still missing. :-)

Besides the normal headers, this layout organize the poster's content in four circles, I took some ideas of the betterposters blog that I mentioned: Using a QR code that points to the website of the tool(actually pointing to this blog), and helping the reader by putting signs of the order that the poster should be read.

Other thing that I considered was which font to use, it really irritates me seen posters, presentation or in fact anything that uses the wrong font, for instance, have you seen the new font that the music channel VH1 is using? I hate it, is too big, looks so unprofessional. Dunno if is just me but AGHHRRHH!

I found a nice idea of how to choose your font between hundreds and is to create a poster with the name of the font using that font, so you can see all the fonts in a simple glance, check the idea here. The fonts they are using in those posters are the over 500 freely available fonts of google, you can use it on web anytime, or download the ones that you like and install it in your computer.

And the content of it, oh well, you can read it yourself, and if you have read my previous blog posts,
you certainly have read over 90% of what's in the poster, only difference is that in the poster I'm a little bit more format, therefore I wont talk about it in this post. You can have a look to a reduce image of the poster:
Final View of the Poster.
The Gimp file with all the layers can be download from here, in case you want to adapt it for your own poster. And if you were wondering about the title of this post is because it was a price for the best poster of the event and guess who was the winner!! :-) Here is the pic of the poster in a wall of my office with the winning certificate!! just to show off!!


And a last note, in a different topic, today finally my paper on MyDas is available online, check it out:
http://www.plosone.org/article/info%3Adoi%2F10.1371%2Fjournal.pone.0044180

Time for a beer to celebrate, Cheers!!

Wednesday 22 August 2012

Small Pieces


Hey there people!

In the same spirit of catching up and writing about the things I worked recently (I just noticed I didn't made a single post in the whole month of July), this post describes some small developments that I've made to improve the Interactions Application (See this post).

To be honest, the protein interaction application app is getting more and more interesting, at least for me :-) and for the look of things for  my supervisor as well. We had a brainstorm meeting about a month ago, and from there a whole set of requirements for this app has been documented. Mmm.. documented might be a little to formal... the document is just a page with ideas in no particular order, and I've been working on it based on a combination of two factors: coolness and estimate time of development. I think everybody prefer something cool and simple, than something massive and with low visual/usability impact!

Let's start by a new component I developed, a frame to display the features of a particular entity, and in our app we are talking about proteins and it interactions. In previous versions of the app, there was not way for the user to get extra information about the protein or about its interactions. This is nothing new, there are dozens of pop-up windows, fully configurable and even for jquery, but I also though that it wasn't one for biojs, and if the idea is to reuse all this parts in the framework that I'm gonna create, I've better start to keep this developments under the same library, which, by the way will be a future technical post about implementing the interaction frame as a BioJs Component.


I started by creating a static HTML with its CSS to define the look of the frame, see screenshot above. A simplified version of the HTML is below this text, and basically is a DIV element with a header and a list as content. The rest is CSS magic to make it look nice. Click here to see the static example.

<div class="protein">
  <header class="protein-label">P64747</header>
  <ul>
 <li class="protein-description"><h2>Uncharacterized protein Rv0893c/MT0917</h2></li>
 <li><b>Gene-Name:</b>Rv0893c</li>
 <li><b>%GC: </b>60.63</li>
 <li><b>Location: </b>Unknown</li>
 ...
  </ul>
</div>

Obviously this is interesting only if the features are loaded dynamically, and that's when this as a BioJs component is useful. So the component has a constructor method that creates the skeleton of the frame, and activates 2 optional features: to be able to minimize, and to be draggable. I used Jquery UI for these functionalities, and thats why this component has it as dependency. If you wanna check the code you can go to the repository. But also you can play with it in this link and see it in a simple demo, or you can always go to the Interactions app, and see it working in a real environment, and there you will see some of the thing I'll chat in future posts.

All right, this post was a short one.. but better that way... dont wanna start mixing oranges and apples, and actually that leaves me material to talk about it in a next post.

Chau gente!

Monday 13 August 2012

Back into interacting!

WOW, is been a while!!

I'm the first one to be sorry of no having post recently. I've been busy with the paper I mentioned before and is going to get publish pretty soon! :-) Also, the things I have worked on recently are more improvements than anything else and all around the Interaction Viewer(See this post), so I had the feeling it wasn't enough for a post, however now that i checked there are several things I have to talk about, so this might be a long post, or to be split in several. So let's stop of excuses...

First thing I did was to add the Ruler Component (See previous post) into the Interactions Viewer . The initial step is to define the rules for the component, this has to be in a JSON format. Here the rules defined then:

rules: {
  "location": [ ],
  "action": ["Highlight", "Show", "Hide", "Color" ],
  "target": [ {
   "name": "Proteins",
   "conditions": [ {
    "name": "interactions with",
    "type": "selects",
    "amount": 1,
    "values": [ ]
   }, {
    "name": "number of interactions",
    "type": "numeric_comparison"
   }, {
    "name": "accession number",
    "type": "text_comparison"
   } ]
  }, {
   "name": "Interactions",
   "conditions": [ {
    "name": "protein",
    "type": "selects",
    "amount": 1,
    "values": [ ]
   }, {
    "name": "proteins",
    "type": "selects",
    "amount": 2,
    "values": [ ]
   }, {
    "name": "score",
    "type": "numeric_comparison"
   }, {
    "name": "type of evidence",
    "type": "selects",
    "amount": 1,
    "values": [ 
      "neighborhood",
      "fusion", 
      "cooccurrence", 
      "txt_mining",  
      "microarray",  
      "similarity",  
      "domain",  
      "experimental",  
      "knowledge",  
      "pdb",  
      "interlogs" 
    ]
   }
   ]
  } ]
}

As you might noticed some of the values are empty arrays, those will be populated once a Solr response is obtained. What I'm trying to say is, if a rule requires a set of protein to select from, that field is dynamically filled with the proteins presented in the graphic.

The Ruler component triggers events when a rule is added, removed or re-ordered. Is then the interactions app, who applies the existing rules into the graphic, so all this events are going to call the same function:
self.ruler.onRuleCreated(function( objEvent ) {
 self.manager.widgets["graph"].applyRules();
}); 
self.ruler.onRuleRemoved(function( objEvent ) {
 self.manager.widgets["graph"].applyRules();
}); 
self.ruler.onOrderChanged(function( objEvent ) {
 self.manager.widgets["graph"].applyRules();
}); 

The actions defined in the rules where completely related with displaying options: Show, Hide, Highlight and Color. So my strategy for the applyRules method was to create selectors that operate over the interactions graphic(SVG) to filter the elements that pass certain rule, and then operate the respective action on all of them. The full method is rather long so I wont put the whole thing here (You can check it in the repository), instead here are some important snippets of that code.

The method start by getting the active rules and restarting the graphic to get ride of any previous display changes cause by old rules. Then it loops trough the active rules and built the string selector depending on each case. The only rule evaluated in the following code is Proteins Interacting with a specific protein. The selector is an string containing all the IDs of the nodes that represent proteins interacting with the one selected by the user. This is quite easy because when displaying the graphic, a structure with this info was created: self.graph.interactionsA.


applyRules: function(){
 var self =this;
 var rules = self.manager.widgets["ruler"].ruler.getActiveRules();
 var model = self.manager.widgets["ruler"].rules;
 //Reseting the graph 
 self.graph.vis.selectAll("circle").attr("visibility", 'visible').attr("class", 'node').style("stroke","#fff");
 self.graph.vis.selectAll("line").attr("visibility", 'visible').attr("class", 'link').style("stroke","#999");
 
 var selector ="";
 for (var i=0;i<rules.length;i++){
  selector ="";
  var rule=rules[i];
  if (rule.target==model.target[0].name){ //Proteins
   switch (rule.condition){
    case model.target[0].conditions[0].name: // interactions with
     for (var j=0;j<self.graph.interactionsA[rule.parameters[0]].length;j++){
      selector +="[id =node_"+self.graph.interactionsA[rule.parameters[0]][j].name+"],";
     }
     selector = selector.substring(0, selector.length-1);
     break;


If for example i had 3 proteins in my graphic: p1, p2 and p3. And assuming there are interaction between all of them, a rule like Proteins Interacting with a P1 would generate a selector string like [id =node_p2],[id =node_p3]. All the missing logic in this code deals with the creation of the selector for all the combinations for the defined rules. Some of the generated selectors are explicitly listing the id nodes, such as in this first case, and in other cases the selector uses some wildcards to select several nodes with a simpler string.

Once the selector is created an action is executed with it, so for instance if the action is to highlight, the code self.graph.highlight(selector); is invoked. And that method in the interactions component is defined as:

  highlight: function(selector){
   var self=this;
   self.vis.selectAll(selector).style("stroke", '#3d6');
  },


I decided that actions won't really change the color of the node, but instead the color of the border, this with the purpose of conserving the color that relates a protein with the queried protein.

And all that, to be able to display an interaction like this:

All the nteractions of the proteins O05300 and Q7D8M9, highlighting the proteins interacting with O05300.
You can play with all the rules in the live version of this app at http://biosual.cbio.uct.ac.za/interactions/. And you might notice a lot of other details that I haven't talked here yet, but that's material for a next post. Promise to do it quicker than this time!

Chau Gente!

Friday 22 June 2012

Ruling the world!!

Hey guys,

Is been a while eh! As I have said, my goal is to write a post per week, but you might notice that I skiped the last 3 weeks. I was busy with the edition of a paper, I wish writing formal academic documents was as easy as writing for this blog, but is not, specially with several authors, plus reviewers, etc.

Anyways, the paper is about MyDas and I hope this version get publish, I promise to put a link here whenever that happen(if does happen). I still have to work in one more section of it, but is mainly done, so I decide to be back to do some sketching, developing components, using them somewhere! Much more fun!

Remember that interaction component? Well, I though the next step of it was to make that graph more dynamic, so the user can highlight proteins that is interested on, and hide those that are just causing noise in the view. So that requires the user to define some rules for it.

That made me think that the definition of rules for filtering, selection, execution, etc. is a common task in many different scopes, but a lot of them can be written following the same structure:

In [a location in the page] do [an action] to [the target] when [a condition]

So, I thought that it would be useful to have a component to deal with the common tasks of creating, removing displaying and sorting rules. As usual I started by doing a sketch of my idea:

Sketch for a component to define rules

The idea is that the options for the rules are the input of the component, and then, the component should create the forms, lists and will control the look and feel of the rules. The execution of the rules is then responsibility of the one using the "ruler".

So in my idea of the standard rule, conditions can use different type of parameters (text, selects, etc.). And a condition is applicable to a specific target, which then creates the hierarchy Target>Condition>Parmeter. This information should be the input of the component as a JSON  document

{
 "location": [ "Some part of the page" ],
 "action": ["Action 1", "Action 2", "Action 3" ],
 "target": [ {
  "name": "First Target",
  "conditions": [ {
   "name": "Select from",
   "type": "selects",
   "amount": 1,
   "values": ["An Option","another option"  ]
  }, {
   "name": "number",
   "type": "numeric_comparison"
  }, {
   "name": "some text",
   "type": "text_comparison"
  } ]
 } ]
}

So a condition has a type, and the Ruler component will generate the different form components depending on the type, for example a 'selects' type creates a select with the options in the array of values, and the numeric comparison, creates a select with the comparison operandos ('==', '>', etc.) plus a textfield where the user can input a number.

So I implemented this idea using again Biojs. In reality is something simple: When the user clicks in [Add Rule] the component creates a DIV with the text of the rule and generates Select elements for the different parts of the rule. It also visualize/hide the conditions depending of which target is selected, and does the same for the parameters.

When the rule is added, is move to the top list and an event is triggered to inform which ever component is interest about the new rule. Rules can be removed and that also is informed by events, and the order of the rules can be adjusted. Other components can always ask for the current active rules through a method provided.

And I think the key factor is to make it look nice with CSS! So here is how it looks:

Snapshot of the sample view of the Ruler component


And you can play with it Here. I haven't updated the component to the BioJs registry because is not yet documented. Once I do it, I'll edit this post so you can download the component on BioJs. Here is the link in the BioJs registry.

And just to mention this, I did implemented in the protein interaction viewer, you can have a look Here. But this blog is getting long so I will describe what i did there in the next post.

Thanks for reading, and as usual please give me your feedback I do appreciate any ideas/comments about this!

Hasta la proxima!!

Monday 28 May 2012

Protein Interactions

Hello there...

This one took a little longer than expected, but here I'm with another post.

This time is about a collaboration with some of the guys in my lab, that between ideas, data and some work we have created a neat Web Interface to visualize protein-protein Interaction. For now this is Tuberculosis (TB) data, but the idea can be apply to any other protein interaction dataset. This was one in about a week, so don't expect anything more than a prototype.

So, two weeks ago in our weekly seminar, one of the other students of CBIO was presenting something about the interaction of proteins between TB and human. This is an approach used to try to understand how the mycobacteria affects the normal behaviour of a human, or something like that :-P

Anyways, she was presenting this graphs representing the interactions and some questions appear about the surrounding proteins, and how those interact and if there is any correlation between the unconnected parts of the graph. Obviously I was not understanding much of it, but I though that an interactive visualisation of that data may help this clever people to answer their questions.

The graphics that my friend was showing were generated by cytoscape, a very well known tool for this kind of data. I don't know much details of this tool, I kind of remember playing with it a while ago, so to be honest I cannot talk much about its strengths or weaknesses. The only think was the in that moment it was not available, and therefore the valid biological questions were not answered in the seminar room.

Part of the discussion went about the available visualisation tools for this data and how useful (or not) they are. I thought that a web visualisation of this should be, not just possible but simple enough for me to implement, obviously hoping to find a generic graph library. And once displaying the data, it would be possible to play with the representation using web techniques.

After the talk a very enthusiastic friend came to me and started talking about the same idea, plus he actually knew a couple of libraries to displays networks: protovis and Jit. I also did my homework and found out that protovis have become d3 and found another option as well called arbor.

Before seen those examples my worry in this was an algorithm to organize the layout of the nodes in the network, to avoid overlapping and to see the network in a nice way. But if you check those examples the are using a very cool algorithm called force, which pretty much simulates repulsion forces among nodes and tension forces using the links and it does it on the flight, creating a very cool effect.

While I was busy playing with different libraries my friend got some of the data and create a dummy example using protovis. One of the ways to input data in protovis is to have a json file with a particular structure. So, what my friend did was to create a python script to convert a subset of the data into json, and use that to create the graph. Simple and nice as I like it! Below is an image of a part of the generated graph, and here is the link for you to see the example.

15 - Network of 2000 human protein interacting.
But here is our first real challenge, that was a subset of 2000 proteins, and the performance of that is very poor as you can see. Clearly we were asking too much to the SVG engine of the browser. The big problem is that the original file have over 300000 interactions, we were not using 1% of the data and we were reaching the limits of the browser.

In Web development there is a pattern that I have followed for a while, try to make it happen in the client, but if not possible, simply do it in the server. OK, thats not exactly a massive piece of wisdom, specially when in web development there are virtually those two options: server or client. However I know of many developers who insist in doing stuff in the server that now is totally possible in the client, were the latter gaves lots of potential advantages, specially in the usability point of view.

So what I did was to create a Solr server with the protein data, this will open the possibility of doing interesting queries with very short response time, and really easy to implement. Here I make a parenthesis, If you are a developer and you dont know what is Solr, make yourself a favor and go to learn about it, is totally worth the effort.

Back in track, for this proof of concept I am using a very simple dataset of just over 66000 interactions, each of those been the 2 protein interacting and a score of how reliable is this information. in conclusion, for now is just possible to query for protein or score, but the potential of Solr is there and is just a matter of putting more info, such as annotation of each protein.

There is a nice javascript library to deal with Solr queries called AJAX Solr, I have used before in other projects, so I was familiar with it, besides is easy to use and it has a well organize code structure. Its concept is basically to have widgets that react to the moment a Solr response is catched. Moreover, those widgets are also able to execute new queries.

So what I did was to create a widget for AjaxSolr, that uses d3 to generate the graph based in a Solr response, for example, if I query for all the interactions were the protein with UniProt Id Q10387 is presented, I got 45 interactions, so the widget creates nodes for each protein and links for each interaction and just let d3 to do its job!

The rest was just to adapt some of the widgets that the AJAX Solr tutorial has, like the autocomplete or the list of current queries. Here the main change is that the tutorial work joining the queries as a disjunction, I mean using AND operators: query1 AND query2 AND query3. but in our case we require to use conjunctions (OR). and that changes a little of the logic there, but is not big deal.

So here is How it looks, and if you want to play with it you can go to this URL: http://biosual.cbio.uct.ac.za/interactions/. We have many ideas to implement here, and for that we need to put more data in the server, and also the way of drawing the graph can get improved, however we think this is a very nice start point.

16- TB protein protein interactions viewer

And you might noticed I didn't put any code in this blog, oh well if you want some code the good news is that because is a collaborative project with my friends at the lab we set up a google code repository, so you can go and get all the code of this, and everytime any of us make some improvement is gonna be there for you: http://code.google.com/p/biological-networks/

Chao gente!!!

PS: After having develop the prototype a friend told me about a HTML5 library of cytoscape, I guess i didn't did my state of the art homework as good as I though, so I am going to have to check this and see if is worth to use it instead of d3.

Tuesday 15 May 2012

Update to the chromosome component

Hello people,

I know the previous post was quite technical, but this one in contrast is even more technical :-p Not really, I think i have to put this technical details here. So take this as a warning and if you are not into HTML5 programming, you might want to skip this port, and just check this link to see what im working on, I promise other posts no so techy!

So for those few that made it here this post to show you how I used the AreaSelector component to interact with the Chromosome one, so read those post if you haven't yet!

Firstly, the selector is optional for the chromosome component, so there is a new option in the constructor called includeSelector (true by default) and when all the bands have been loaded the selector is added. Then, every time the selector changes, the chromosome listen that event, refresh the corresponding coordinates and generates its own event telling the outside world that the selection have change. The last part of the code below is to insure that if the container DIV changes its size or position, the changes get propagated to the selector. So here is that piece of code:


//Setting up the selector in case is included
if (self.opt.includeSelector){
  //The selector just allows horizontal interaction and is preseted in the first band
  self.opt.selector = new Biojs.AreaSelector({
    target: self.opt.target+'_chr',
    resize_top: false,
    resize_bottom: false,
    area:[0,-5,$('#'+firstid).width(),20]
  });
  //Creating attributes in the object to save chromosome coordinates where is visible, starting in the first band   self.opt.selector.from = 0;    self.opt.selector.to = firstW;    self.opt.selector.fromWatcher=false;
  //When the selector change its position the chromosome coordinates have to be updated   self.opt.selector.onRegionChanged(function( objEvent ) {     if (!self.opt.selector.fromWatcher){       self.opt.selector.from = self._getCoordinateFromLeft(objEvent.region[0]);       self.opt.selector.to = self._getCoordinateFromLeft(objEvent.region[2]);       self.raiseEvent('onSelectorChanged', {         chromosome_id : self.opt.model.id,         selector_start: self.opt.selector.from,         selector_stop: self.opt.selector.to       });     }   });
  //if the div containing the chromosome is resized or moved the selector is modified with   $("#"+self.opt.target).watch("left,top,width,height,display", function() {     self.opt.selector.fromWatcher=true;     if (self.opt.selector.from!=null && self.opt.selector.to!=null )       self.moveSelectorToCoordinates(self.opt.selector.from,self.opt.selector.to);     self.opt.selector.fromWatcher=false;   }, 100, "_containerMove");
}


Other methods were implemented, mostly to handle conversion between the DIV coordinates and its coresponding chromosome coordinate. A method to directly change the position of the selector was added, so other components can interact with the chromosome view. Lastly 3 more events are associated with this component:  onModelLoaded to indicate that the DAS model has been succesfully loaded, onDASLoadFail in  the case the DAS source have any problem to be loaded, and onSelectorChanged for any position change on the selector.

The final result looks like the image below, and the code is now in the biojs registry here so you can play with it and use it whenever you want.

14 - Chromosome + AreaSelector component


Another part I worked on, came from a comment of a friend in this blog, and is that when displaying all the chromosomes, they were draw in the same size, which is not a good representation, each chromosome have a different number of nucleotides, and therefore its dimension vary.

The component was developed to auto-adjust to the assigned size of the container DIV, meaning that if we create DIV that are proportional to the size of the chromosomes, the representation will be more accurate.

The only problem is that a to be abe to calculate the proportions i need to know the size of all the chromosome, and because the info is geting asynchronous, is not something that we can just loop.

So what I did was to use the event onModelLoaded, to know when the component has finished loading the model, and in this way externally capture the size of that component, to adjust the width of the DIVs every time another chromosome is completed.
The DIV sizes, are then calculated with respect of the longest chromosome represented, this one has a width of 100% and all the other percentages are just proportion of it... Wow, thats a lot of words for just this piece of code:


  inst[i].onModelLoaded(function( objEvent ) {
    $("#holder_"+objEvent.model.id).data("size",1*objEvent.model.stop);
    adjustSizes(1*objEvent.model.stop)
  }); 

...

var maxSize=0;
var adjustSizes= function(size){   if (maxSize<size)     maxSize=size;   for (var i in chromosomes){     var chr=chromosomes[i];     if($("#holder_"+chr).data("size") != undefined){       var size = $("#holder_" + chr).data("size");       $("#holder_"+chr).width( (size/maxSize)*100 +"%");     }   } }


Below you can find a screenshot of this running, but if you want is to watch it in your browser just go to this LINK.

15 - Chromosome X and Y in proportion.

And that's me for now... Thanks for reading this, and please give me some feedback about it, I would like to know if someone is reading this and if is making any sense.

Hasta la vista!!!

Saturday 12 May 2012

Area Selector and Chromosome Component

.position() .offset() .left . top .width() .height() .parent()

Those are the 'words' that I have written the most during the last few days. And the ones that I have spoken I had better avoid mentioning, in case it causes my blog to be censored.

Here is the story: after having finished the Chromosome component, I thought it would be cool to freely select and adjust areas in the chromosome, and not just select the bands as it was doing. I thought that a semi-transparent div at the top of the chromosome could do the trick, so it was just a matter of some styling and I have a div that shows what's selected in the chromosome. Then it's just javascript playing with the DOM to modify position, and size.

Simple! So let's start with a static HTML and its CSS. The Div is going to contain other divs that will work as the points to scale the div:

<div class='selector'>
  <div class='scaler top'></div>
  <div class='scaler bottom'></div>
  <div class='scaler left'></div>
  <div class='scaler right'></div>
</div>


So I defined a couple of styles in the CSS, defining the transparency, the position and size:

.selector {
  border: 1px solid #FF0000;
  position: absolute;
  margin-left: 0px;
  margin-top: -5px;
  height: 25px;
  width: 30px;
  z-index: 10;
  background-color: rgb(100%, 75%, 75%);
  opacity:0.4;
  filter:alpha(opacity=40); /* For IE8 and earlier */
}

.scaler {
  position: absolute;
  height: 5px;
  width: 5px;
  background-color: white;
  border: 1px solid red;
}


You can check the fully working code here. It looks like this:

12- Snapshot of the chromosome component with a overlapping div

So how hard could it be to make that div fully dynamic as an independent component? Easy peasy!
How wrong I was!! Well I'm not trying to say that it's incredibly complicated, but something that I estimated doing in one day took me the whole week. Hope that this is not going to be the rule in the rest of this project.

In reality the whole thing is not complicated, it's just a matter of transforming coordinates from the HTML document to the Chromosome space, and vice-versa. Plus having control of events to drag&drop the scalers to modify the size, location of the selector div. And saying it in that way makes me think again that it was something easy.

So, I tried to do the trick with mousedown() mouseup() events recalculating coordinates and redrawing things, but this didn't work because if you move your mouse too quickly you will move out of the scaler div, and it wont recognise the mouseup() event.

Then I realised that I was committing the classic mistake of reinventing the wheel. I mean that above is the description of a Draggable component in jquery UI, and for a moment I even thought that the whole thing could it be done by the Resizable component. But this one just modifies the size from the bottom-right corner, and what I want is something I can change from any side, conclusion back to my idea, but now using a jqueryui.

Here is the code for the draggable actions of the right scaler, the other scalers are pretty much the same, although the left and top required modifying the position of the div and not just increasing the width or height.


$("#"+self.opt.target+" .selector .right").draggable({
  axis: "x",
  start :function(event) {
    self.updateScalers();
    $(this).parent().css('border-right-width',"0px");
  },
  stop :function(event) {
    $("#"+self.opt.target+" .selector").width(self._removePx($(this).css('left'))+5);
    $(this).parent().css('border-right-width',"1px");
    self.updateScalers();
    self.raiseEvent('onRegionChanged', {
      region : self.getCoveredArea()
    });
  }
});


Obviously there is a lot more code than this, but this pretty much describes the task. The function updateScalers, repositions the divs that I used to create the effect. It also recalculates the limits of the enclosing div.

Another thing that I did for this component was to make sure that if the container changes its position, the constrains get automatically updated. In order to do that i found a plugin for jquery to watch a DOM element and react in that case. You can read some details here.

So this is how the Area Selector looks, I also created some methods and triggered some events in this component, so it can really interact with other elements.

13- Snapshot of the Area Selector component

You can play with it here, and soon it will be on the repository. I will update this post once it is online.
I just finished the interaction between this and the chromosome component and I will post about it at the beginning of the week.
For now, I'll be back to my super-lazy weekend, hope you guys are enjoying yours. :-)


EDIT: Here is the link of the AreaSelector in the registry (LINK)

Friday 4 May 2012

A chromosome component

Hello People!

So, it have to happened, took me a while before falling in the temptation of starting to code. If you are a developer you know that until you have something running you dont feel like you have progress, no matter how much documentation, design, architecture or any of that so-called work have you done, the only progress is in code running, am I right??

So my lame excuse to start coding this time was about getting familiar with Biojs, I have mentioned before, this is the javascript library of web components that a friend is developing, I though about using this as the base of the Registry component of BIOsual, and the only way to really understand a library is to develop with it, isn't it?

And where else to start that by a 'Hello World' Tutorial. Biojs is as agnostic as me, although in javascript that term is not related with religions, what it means is that it doesn't know or even better, it doesn't care if you are using a framework (eg. jquery, YUI, prototype), so the developer can choose to use whatever works better for him/her, which in my case is jquery, so the tutorial uses it, but it could it be done using any other library or by no using any, but just plain js.

Anyways, in an attempt of learning by been productive I decided to do a mini-project with Biojs, and develop a small component, that help me to understand completely the library, but that it could be used as uno of the components for BIOsual, and then I though in a chromosome, displaying its bands. Here a  little of biology about the chromosome bands.

The Idea


I am starting to enjoy the idea of sketching, so here is the sketch of the visual component that I was developing:

9 -  Bands of a chromosome.
Inspired in the way that myKaryoView displays the chromosome, I decide to display a chromosome based on html elements, myKarioView does it with <a> but i decide to go with <div> just to avoid the '#' in the URL when you use those elements to trigger an click event instead of a normal link.

Then I though that getting that is something that can be done by plain HTML with some CSS styling, and then I literally came out of bed with the idea of doing some HTML+CSS that represents a chromosome, with the idea of doing the HTML as simple as posible, and this is how the code looks:


<html>
<head>
    <link rel="stylesheet" type="text/css" href="biojs.chromosome.css" media="screen" />
  </head>   <body>     <h1>Basic html example for a chromosome
    <div id='Chrmosome:8' class='chromosome' style='min-width: 480px;'>       <div id='p11.22' class='band gpos25 first' style='width: 25%;'></div>       <div id='p11.21' class='band gneg' style='width: 15%;'></div>       <div id='p11.1' class='band q_acen' style='width: 10%;'></div>       <div id='p11.1' class='band p_acen' style='width: 30%;'></div>       <div id='p11.1' class='band gpos75' style='width: 12%;'></div>       <div id='p11.1' class='band gpos50 last' style='width: 6%;'></div>     </div>   </body> </html>


In this way the html just have the structure of the chromosome, and all the looks resides in the CSS:


.band {
   position: relative;
   z-index: 3;
   height: 15px;    border: 1px solid #333;    border-right: 0px;    border-left: 0px;    border-image: initial;    cursor: pointer;    float:left; }
.q_acen, .first{    border-left: 1px solid #333;    border-top-left-radius: 4px;    border-bottom-left-radius: 4px;    -webkit-top-bottom-left-radius: 4px;
   -moz-border-radius-bottomright: 4px;    -moz-border-radius-topleft: 4px;
}
.p_acen,.q_acen {    background-color: #DDD; }


There is more in the CSS but is pretty much copy/paste of what you seen here to create the rest of the borders, and the different colours for the band's types, so it looks like the image below, and you can check that HTML here.

10 - HTML test for displaying a chromosome

The implementation

It looks cool, but the whole point is that it should be generated from real data, and here is where the javascript became important. Firstly I'm gonna take the information from this Ensemble DAS source, and for this example I am using the chromosome 8 of the human data set, but it apply to any organism with a chromosome based genome, and in the URL just change the segment to get a different chromosome.

For the parsing of the DAS response I'm using JsDAS, a library that allows me to do the ajax query to a das server and gave me the response as a javascript model, you can check the tutorial and see how easy is to work with this library.

From there is just a matter of create a DIV element for each feature in that response. As I mentioned before I'm using jquery here, it really makes my life easier to deal with the DOM of the page, and the whole point is to use BioJS. Following the rules of Biojs, or any framework in particular, feels like you are doing more work than need it, but in the case of Biojs, the benefits really are worth.

To begin with, you have to document with javadoc style, and for those like me, that love java, documenting in this way takes out part of the tediousness of the documenting task, not completely, but anything that helps there is welcome!

BioJs has a mvn file to facilitate the generation via maven of the documentation, reorganize the code, but most importantly, it creates a web registry, where based on the created documentation is able to visualize, important information of the module, for instance, methods, events, dependencies, and even a live example of the component, so whoever is having a look to the available components, can always see a demo of the components.

Creating a full registry of your components in your machine is nice, but the whole point is to create a community, and to do that the components have to be web visible, meaning having a central repository.  For now the repository is based on the components that have been sync in the source repository of the library, but the main developer confirmed that there is work in progress to create a repository similar to the jquery one,  exciting news from there!

So without more talking here is my chromosome component in the BioJs repository, so anyone can use it! but in a more selfish point of view, the firs component that can be used for BIOsual, given the good experience with it I think i should keep thinking in the visual components using it, and in doing the registry of BIOsual based on BioJs.

Lastly, here is a page displaying all the human chromosomes that looks like this:

11- snapshot of the chromosome component

Cheers!!

Tuesday 24 April 2012

Sketches (Part II)

Hello There,

Sooner than expected I'm here again writing a new post. To be honest this is some material that I had last week, but the previous post was getting too long and it was taking me a lot of time, therefore I split it and here is a second part. So continuing the idea here I'm gonna show some sketches i made to start having a better understanding of the project.

In this post I will focus on the configuration of a Domain in the Multi-Domain Configuration MDC mode (Remember the 3 parts the project is going to be divided). Here I'm assuming that a lot of components have previously registered in the BIOsual repository, this is important to me because is helping me to define the requirements for the repository mode.

So, once a domain is in the dashboard it needs to be configure, and to open the configuration panel a click in the domain is all am asking for. If is a predefined domain most of the configuration is done, if is a new Domain, the information has to be fill from scratch.

The way that I imagine the domain configuration now, includes 5 different sections, that in the sketches I have organise as tabs: Reference, Tracks, Entry Points, Components and Filters. Obviously at this stage everything can change, but this is the route I'm tracing and as long I reach the goal I'm willing to make changes once on it.

Domain - Reference 

Every domain has to have a reference source of information, for instance,  the whole genome of an species organised by chromosome for a DNA domain or all the available sequences for the Protein domain.

This information can be acquired in different ways.


4 - Setting up the reference of a domain.
So in the sketch I'm showing 3 options to load the reference:

  • By using a DAS source, this can be done by selection one of the more than 190 DAS reference sources or by directly inputting the URL of the DAS source.
  • Sequence Files (web): Some NGS files like BAM allow random access through http requests. This make possible to use a remote file as a reference without having to load the whole file.
    The full genome can be divided in several of those files, so the system should allow to load more than one, and provide a way to identify them. Thats why I add the ID field.
  • Sequence Files(local): Other option might be to have local files as reference. For the case that the files are in the user machine. This might be tricky because of the limited access of javascript into the client machine.
BTW, does anybody knows if there is anything similar to BAM that just includes the sequence, like a fasta file that can be accessed in a particular position??

Other ways of loading a reference can be using databases, web services, or many other ways that I can not even thing about it and thats why this is based on modules that have to be registered in the BIOsual repository.

Domain - Tracks

And here guys you will have to apologize me, this is the most confusing of my sketches so far, and that's just a sign that I'm not sure about how to deal with this info.
Tracks are the classical way of displaying biological information in context to a reference (eg. Ensembl, Dasty3, UCSC genome browser, etc.) And basically a track consists in drawing a box in a position that aligns directly with the reference, so you can see where an annotation is located in a chromosome, protein or any other sequence.

5 - Setting up the visible tracks of a domain.
So each domain can have tens of tracks, coming from different locations in different formats to be displayed in different ways. Here is another place to modularise.

I will need adaptors for reading formats, I have to get a consensus of which information is relevant here and been able to put it in the same way no matter how is the source defined.

The system also requires to have options to visualise this info, the boxes idea explained above might be generic one, but for instance genes are composed by a series of exons and introns and the common track representation is boxes for the exons and lines for introns. Other annotations have an score, and a histogram representation might be more adequate.

So the sketch number 5 shows that when in the tab to configure the tracks, a list of the already set tracks is displayed, info in the list can be edited, tracks can be removed from the list and the tracks should be draggable to organise its order.

An option to add a new track is presented and if clicked a form should be injected in the config panel. This form depends on the type of source, because the way of access info changes, the form has to be defined as part of the module. So for example if the type of source is DAS the interaction should be similar to the one for the reference.

The visualisation method use for a particular track is also chosen in this form, and it might contain advanced setting for it, such as to associate a CSS style file.


Domain - Entry Points

The way of accessing the information vary from domain to domain, for example in genomes, isnormal to go to a particular location indicated by the chromosome and the range of base to visualise, but in proteins there are not chromosomes, and the way usual way to access is by the accession number and the location is not that important because the length of those sequences is not really big.

6 - Setting up Entry Points for a Domain

And then, here again the idea of modularise, visual components have to be register to select a region, and is the task of the designer of a MDC to select the appropriate Entry Point selector.
The image shows that for DNA a karyotype selector is set, to allow seen the high level structure of the whole genome.

But more than one Entry Point selector can be desired in a Domain, in the image I also consider that a location selector, and a search in track, the first one can be as simple as text boxes to capture the coordinates, or a slider to select a region or any other interface that allows the selection a region in a genome.

The search in Track is the way I can think in a generic component that can offer the functionality of accessing directly a gene for example.


Domain - Components

Sorry is getting long again is just 2 more to go, the other tab to configure a domain is to include other components that are not displayed as tracks, mainly because there are not associated with a location or because its content cannot be represented in a unidimensional graphic interface. For instance the 3D structure of a protein or its non positional annotations.

7 - Other Visual Components

This components have to be also registered in the BIOsual repository, and each of them have to have their own configuration values to be display in this tab. 


Domain - Filters

And finally and optional feature that i thing can be really useful, a post query filter based on tracks where the designer can define a rule to accept or reject an of the annotations in the tracks.


8 - Filtering the collected data

For now I think that the rule should be define by indicating, the track is going to affect, if is inclusive or exclusive, the parameter to filter, and operator and a value. So in the image, a rule is defined to exclude all the features in Track 1 with a score higher or equal than 0.8

As an optional feature this might not be part of the firs prototypes but I think is something cool to have in mind.


I was getting quite technical for some moment do it might be a boring post, I had fun drawing this sketches, but the most I write the most i realise in what kind of project I'm embarking myself. But i suppose is part of the fun. So if you made it to this part of the post and have any comment/idea/question please let me know.

Un fuerte abrazo,

Gustavo.

Friday 20 April 2012

Sketching (Part I)

Hey there people!

So I still quite excited about this project, and I hope this attitude last for long, but I know myself and that's usually not the case. So, trying to use this enthusiasm in the best way, I decide to start by creating some sketches of how I imagine the app has to be, and hopefully this will help me to define a good set of requirements. All this with the idea that whenever I'm not so inspired i can just take a requirement and work on it, and use that to find the enthusiasm again, or at least to progress even in the not so cool times.

Let's stop the chit-chat and let me show you which ideas I have have this week.

Firstly, I think the key for a system like this(at least one on the keyring) is to modularize. From the input methods to the visual components. And when I talk about modularize I'm thinking in defining a plug-in architecture that supports the control of the different components, and for instance, if a new format for dealing with annotations is found, a input component can be created and the rest of the system can then used without interfering with other parts.

To achieve this a think is necessary to divide the system in 3 parts (you know our all friend "divide & conquer):

  • A repository for components of different types(input, filters, visualisation, etc.). 
  • A Multi-Domain Configuration (MDC) editor, that allows to define which domains are going to take part of a visualisation, how to relate those domains, which annotations will be displayed, etc.
  • An the visualisation itself, where the user for example choses a location in a chromosome, and the related annotations are displayed, and the other domains also get updated in the corresponding region.
And for now my ideas are being centered in the MDC editor (and yeah, im gonna start using that acronym a lot). So here I'm going to explain how I imagine this side of the system, and for that I am putting some handdraw sketches that I did and scan, so lets start for apologising for my awful handwriting, but I'm blaming the QWERTY keyboard for it(no really i had awful handwriting before been tied to a computer).

The approach I'm using here is not formal at all, and I'm continuously moving from web design characteristics to core requirements, look&feel idea, algorithms and implementations. I just hope that by writing about it I can start organising my chaos.

Anyways here some of those sketches with a bit of explanation of it.

MDC Menu


The first one is a to show the high level options that the MDC editor should have, I initially though I was going to call this menu dashboard, but then i decide is better to called MDC and the dashboard is the area where the action will happen(Next images).

1 - MDC Menu. High level options of the MDC Editor.

Classic File menu options are here, not very exciting. New, will clean the dashboard and will take the normal preventive actions to avoid losing changes. For Open and Save I will have to create a file format that includes all the configuration details of a MDC. I've been a XML fan for years, but all this been JavaScript, makes me think that this format has to be JSON.

Notice that those options dont include any server processing, I'm thinking here in creating the file in JS and the user can save this file locally, and to load his MDC it uses the Open option. Having MDC saved on the cloud is also an option, but that will requires users and authentication and I'm going to focus in a application that does not require any kind of authentication.

The Templates sub-menu contains a set of previously created MDC that are almost ready to use, for example, a 2 domains MDC: Human DNA from Ensembl and Proteins from UniProt; mapping them through an alignment DAS server. So in this case a user can have all this ready, including some by default annotation tracks, like genes and OMIM for the human domain, and InterPro and PFAM for the proteins. Then the user can star adding his tracks there, or a completely new domain.

The final option is to Run whatever is on the dashboard. Obviously this will require some validations verifying that all the domains are corrected configured, but if everything is OK this is the start point for the visualisation part of the system. I'm not sure if this is the best way of connecting the parts of the system, and which validations to do, but those are problems for the future Gustavo, not me.

Adding a Domain

And now with the second sketch, where the user is defining which domains are going to be used in the current MDC.

2 - Adding a domain into the dashboard.

So from another menu, or from a button in the dashboard (I'm thinking in the kind of android ICS screen icons) a set of available domains is displayed, similar idea as in the template submenu. And domains are circles, representing a scope. The user then, can drag a domain and drop it into the dashboard, it will be automatically aligned at the left with any other Domain that has been added.

If the user doesn't want to use any of the templates, it can drag the New Domain, which is a complete empty template that has to be completely defined, from its name to the style used at the visualisation stage.

So the circle idea is inspired in google+ hope that wont creates here a patent issue. ;-)

And I already found some jquery plugins that can create a similar effect, have a look to this demos:


Relations between Domains

Once the user has more than one domain in the dashboard, a relationship can be created between them, and basically my idea is that the relationship is created by a drag an drop gesture:

3 - Creating a relationship by drag&drop domains

I hope the sketch is self explanatory, but basically what I want is that if a domain is drag and dropped over another domain a relationship between them is created. Logically there is a lot more to define, and therefore a configuration panel for the relationship has to be open once a relationship is created.

Tons of things to define here, like what if other configuration panel is already open? how to make sure that changes are not lost? should I allow to create relationships while a configuration panel is open? And we haven't even touch the topic of how to define a relationship. More issues for the future Gustavo, that dude is gonna have lots of problems.

Some examples of drawing arrows in the web:


But it really depends of what is going to be my general strategy for drawing,  if you have an opinion about how should i do the visualisation please let me know, I'm considering things like Raphael, or working with SVG, or Canvas, or just plain alignment of DIV elements... again that shows that i have a long way to go, but I have to start somewhere.


OK this Post is getting long and I dont want to bore my crowd of readers (about 2 friends and my girlfriend). So I will try to post soon to show you more sketches and hopefully a first version of the requirements document.

Hasta la próxima!

Friday 13 April 2012

BIOsual Idea!

So, I've been playing around trying to define my PhD project. My interests are in visualisation and integration of biological information. I've done some other small projects in this field, but I haven't been able to find a project that fully interests me and that I can use what I have been working on for the last couple of years. Until now...

In the last meeting with my supervisor we were talking about different projects that our lab is involved in, and a common problem on those was the difficulty of moving the information from different domains, which means, for example, that the data obtained in a microarray experiment is hard to put it in context with genomic and proteomic information at the same time, i mean that is possible but it always requires extra work.

Other big issue is that thanks to high throughput technology the amount of generated data is massive!! I'm talking of files in the order of tens of gigabytes. And thats the kind of data we have to deal with. So whats my idea? Simply a tool fully configurable to visualize biological information from multiple domains. Pretty cool eh?

Well if you are in the bioinformatics field that sounds like one of the holy grails in our field. So yeah, thats what I'm gonna do. Oh well, thats pretty ambitious, but there is a lot of work done on it and I think big part of this mission is putting pieces together, for instance a good friend is working on a library of JavaScript components for biology, so I plan to use a lot of those. Another friend developed a protein annotation viewer based on DAS called Dasty, and it has a really nice architecture based in plugins, I know this because I helped in the design :-). Other friends have worked visualising genomic information, specially focus in personal genomics(myKaryoView). I also did some collaboration there.

And that's why I think I can came up with something useful and cool, but knowing myself I have to keep the motivation high, and thats where this blog became important. I will try to post at least once every 2 weeks reporting the progress that I have done, if any, and in that way force myself to do something to be able to write something. We'll see how it goes.

For now I started writing the requirements and drawing some sketches of my ideal interface, I will show those in my next post. So, for now wish me luck and please give me ideas about the project.
Just to finish, I want to say that although the genomic information maybe the central part of my project the motto of this project will be BIOsual: Not just another genome viewer.